Geography of the world's natural resources. Pollution and protecting the environment
Nika Chitadze
Ph.D. in Geography
Professor of the
International Black Sea University
Director of the Center
for International Studies
President of the George
C. Marshall Alumni Union, Georgia – International and Security Research Center

Introduction. Theoretical
approaches to the topic
The
whole history of human society is the story of its interaction with the
environment, i.e. "metabolism" between them. Therefore, in many books
on Geography, it is indicated that the problems connected with the geography of
the world's natural resources, pollution, and the environment are one of the most
important parts of geographical science. In order to understand it better,
let's start with some basic theoretical approaches and first look at the
"three pillars" of this issue - the concepts of the geographical
environment, the environment, and nature.
The
concept of the geographical environment is one of the most important in geographical science. It was proposed in the late XIX century by the French
geographer Reclus and gradually deepened becoming the core of the doctrine of
the geographical environment (Marshall P. 1995).
The geographic environment is called the part of earthly nature, to which the human society
interacts directly in the lives and production activities at this stage of
historical development (Eckersley, R. 1992).
Everything
seemed to be perfectly clear. Nevertheless, this concept is linked with
three issues in respect to which geographers had and still have different
points of view.
The
first one is the question of the degree of "occupation" of the
environment. Some geographers believe that nowadays the geographic shell in its
primitive and natural type does not exist, and therefore, the concept of
“nature" and "geographical environment" should be regarded as
synonyms. Others, however, who actually form the majority, consider that the
environmental issue will be put on the agenda a bit later when humanity
explores the environment fully.
In
his Dictionary on Nature Protection N.F. Reimers presents the opinions of
American Scientists, which are derived from the analysis of satellite images of
the earth's land surface. They suggest that on an additional 48 million km2 of
the land (31%) there are no visible signs of human activity. In North
America, the "wild" land accounts for 38%, on the post-soviet space –
34%, in Africa, Australia and Oceania – 28%, in Asia – 19%, in Europe - about
3%. In addition, on 28% of the Earth's
territory natural ecosystems are partially broken by a man only (A. V. Cheltsov.
1992).
The
second issue is connected with what the definition of the geographical
environment should include.
Supporters
of broader interpretation believe that the geographical environment includes
not only natural but also technological elements. So, they even offer to
replace this notion with "anthroposphere", "technosphere",
"socio sphere" or "noosphere." Proponents of a narrow
interpretation of the argument agree to include to the geographical environment
the natural elements of those natural-anthropogenic elements that are capable of
self-development without human intervention (arable land, garden, forest belt,
reservoir, etc.). But it is not reasonable to include purely man-made
elements.
Thirdly,
it is a question of the geographic environment in the life of the society. In
this respect, two types of mistakes are made while putting effort to solve the
problem: an exaggeration of its role and underestimation.
Exaggeration
of the role of the geographic environment is called geographical determinism.
In the broad sense, determinism is the philosophical concept, which is derived
from Latin. Determinate, which defines and means the natural interrelation and
interdependence of various causal phenomena. However, when geographical
determinism is involved, it is an exaggeration of the role of the geographical
environment.
Historically,
geographical determinism was born at the earliest era of geography and then for
2.5 thousand years was perhaps the dominant idea, including the period of the
New Age. For example, in the XVII century, enlightener Charles Montesquieu wrote
that the "power of the climate is stronger above all the authorities"
(Charles-Louis de Secondat de Montesquieu.
1750). The anthropogeography school in Germany and the school of "human
geography" in France were under the strong influence of geographical
determinism in the XIX century. In the contemporary period, geographical
determinism adopted more subtle forms, acting as a kind of neo-determinism.
It's either called possibilism (from the French. Possibility - possibility)
originating in the general provisions of quite a correct view that the natural
environment is a prerequisite for human activity, and environmentalism, which
still pretty straightforwardly puts development and deployment of the economy in a
very strong dependence on nature and its resources (Preston E. James. 2006.
p.194).
Underestimating
the role of the geographical environment in the life of people is called
geographical indeterminism and one of the leading geographers N. Baranski
called it geographical nihilism (Baranski, 1928). It is also characteristic of
some geographical schools in the West.
The
notion of the environment was introduced in science in the 70s. and has been
used widely ever since.
Environment
(or human environment) is a set of natural-anthropogenic and man-made objects,
phenomena, and processes external to human nature with which they are in direct
or indirect relationships.
Consequently,
the environment includes natural and industrial, social and residential,
cultural and informational, and other human habitats. In this context, this
notion is a largely reconciled old debate about what is included and what is
not included in the geographic environment. If the human environment is
considered only as of the natural environment, it needs to be called the natural
environment.
The
concept of consumption of natural resources is also relatively new. It came
to the academic community in the late 50ies of the twentieth century. The emergence of
a doctrine of natural resources is coming already to 70ies, when in the
"man (society) - nature" significant and often irreversible changes
began to occur. In turn, the situation has led to the need for a more comprehensive
and in-depth analysis of various aspects of the interaction between society and
nature and ways to optimize it which actually is the most common challenge of
nature. Then the scientific definition of the concept began to appear, which
can be frequently found in the literature. We restrict ourselves to one of the most
concise definitions:
Consumption of natural resources - a combination of all forms of exploitation
of natural resources by potential and conservation measures (A. Dobson. 2000).
It
is taken to distinguish between a number of species (branches) of nature:
industrial, agricultural, forestry, fishing, communication, recreational, and
each of them can be intensive and extensive.
These
are the fundamental concepts of the topic. But for a deeper understanding of
its theoretical foundations, it is necessary to consider two interrelated
aspects. The first is that human society produces part of its resources from
the environment, thereby impoverishing and even exhausting it. Notably, only
minerals extracted annually from the Earth include more than 300 billion tons.
If we calculate how much it will be per capita, you get an impressive result -
more than 46 tons!
The second
one implies that human society constantly pollutes the environment (V. Neidze. 2004).
In
geography, including socio-economic, geography of natural resources is also
involved while considering the problem of rational use of natural resources and
resource supply.
Natural
resources are regarded by us as environmental components which are used in the
process of production for meeting the material and cultural needs of society.
As
for the issue of classification of natural resources, the most important ones
need to be addressed here.
First,
it is the classification of natural resources according to the natural source of
their origin or genesis, according to which they are divided into lithosphere
resources (mineral, land, soil), hydrosphere (water, land and oceans, energy
rivers, and tides), atmosphere (climate, wind) and biosphere (flora and fauna).
Natural resources divided into minerals, water, land, soil, flora, fauna,
solar radiation, moving water, etc. serve as the variation of this
classification.
Secondly,
it is a classification of natural resources according to their possible use in
human activities. This involves resources for industrial production (mineral,
water, forest, etc.), agricultural production (agro-climatic, land, soil,
water, etc.), transport, recreation, tourism, etc. They can be considered as
a fractional - such as resources for the fuel and energy industry, metallurgy,
chemical, timber, textile industry, for construction.
Third, the classification of natural resources according to their degree of depletion.
Obviously, they are divided into two large groups - exhaustible and
inexhaustible resources. In the group of exhaustible resources, non-renewable
resources are considered the economic exploitation which could ultimately
lead to their exhaustion, and renewable resources are located within the
Biosphere cycle of matter and with the ability to heal themselves in terms of
being commensurate with human activities. Inexhaustible resources belong to
such types of resources the lack of which does not represent the threat for the
future generations of the people. For example, in terms of solar energy
resources, it is estimated that they exceed the current needs of humanity by 20
thousand times! (Maksakovsky V. 2009). Additionally, to be classified into natural
resources according to their degree of exploration, they are subdivided into
traditional and nontraditional.

Fig. 1. Classification of natural resources in the degree of depletion
Source:
http://greenenergyhomedesign.tk/tag/green-energy/page/237/
Geography of the world's
natural resources: mineral and land resources
In socio-economic geography familiarity with natural resources usually
starts with mineral resources (minerals) - the main "building blocks"
of production. The fact is that people have learned to use minerals in ancient
times, according to the names of these epochs of human development, such as stone, bronze, iron centuries. If in the Middle Ages from the Earth's crust
were extracted only 18 types of minerals, in the XIX century the number
amounted to 47. In our days, according to the figurative expression of the
geologist – A. Fersman "at the feet of humanity is composed all of the
Periodic System of Mendeleev," or rather – more than 200 different kinds
of mineral resources are used (Science Encyclopedia. 2005). They can be
subdivided into three groups: 1) fuel, 2) ore (metal), and 3) non-metallic.
We
will not be wrong if we say that – It is reasonable to state that fuel
resources have big importance. Their characteristic usually begins with a
quantitative assessment, but you have to consider that we can talk about a wide
variety of categories of such assessment. As for the geological data of the
fuel resources of the world, now they are estimated at 5.5 trillion tons of
fuel (in tons) and proven reserves, which we will continue to deal with - at
1.2 trillion tons. But it is more important to know exact figures of proven
reserves of coal, oil, and natural gas. Coal is one trillion tons, oil - 192
billion tons, and gas - 175 trillion m3 (V. Maksakovsky, 2009).
According
to the quantitative importance, consideration of geography of fuel resources is
of particular interest to us. From the global analysis point of view, in
general, these resources are widely distributed in the earth's crust. So, coal
basins and deposits amount to 3.6 thousand and together they occupy 15% of the
total land area, being located in more than 80 countries (V. Neidze. 2004). Oil
and gas basins in the world amount to at least 600 and deposits - up to 50
thousand (V. Neidze. 2004) whereas prospective oil and gas areas exist in more
than 100 countries (N. Chitadze. 2004) and collectively occupy more territory
than coal.
At
the same time placing of fuel resources can not be considered equal. To
understand its laws, you have to remember the geology and, in particular, the
fact that deposits of fossil fuels are always associated with sediments and
tectonics. So, maps of minerals should be of the tectonic framework which does not
always take place. It is also important that fuel resources are typically
spread waist, forming a vast belt of coal accumulation of oil and gas that
formed in those geological eras when there were peaks of coal, oil, and gas.
For
example, the major coal basins of Europe form a latitudinal belt stretching
from the UK via Belgium, northern France, and western Germany, the southern part
of Poland, and the northern part of the Czech Republic to the Donets Basin. The emergence of this belt coal accumulation took place because the Carboniferous geological
period was the one when the majority of geopolitical processes got reflected
on the farthest north arch of the
Epihercynian platform. Therefore,
this belt and pools - the Ruhr, Upper Silesia, Donetsk, etc. - exhibit certain
geological similarities.
From the global, let’s now proceed to the
consideration of the regional level, using the data in Table 1.
|
Region |
Coal.
Billion Tones |
Oil,
Billion Tones |
Natural
Gas, Trillion M3 |
|
Post-Soviet
Space |
230 |
20,3 |
56,0 |
|
Europe |
125 |
2,7 |
6,0 |
|
Asia |
215 |
106,2 |
82,5 |
|
Africa |
55 |
15,1 |
13,0 |
|
North
America |
260 |
31,1 |
7,0 |
|
Latin
America |
30 |
16,7 |
7,5 |
|
Australia
and Pacific |
85 |
0,2 |
3,0 |
|
Whole
World |
1000 |
192,5 |
175,0 |
Table.1.
Source: Distribution of the proven energy reserves in major regions of the
world at the beginning of XXI Century (V. Maksakovsky. 2009)
The
following is concluded from Table 8: Proven reserves of the coal in the world
are highlighted in North America (26%), post-soviet space (23%) and Asia
(21.5%), oil reserves in Asia (55%), and natural gas reserves in Asia (47%) and
the post-soviet space (32%) (V. Maksakovsky. 2009). Therefore, during geological history best conditions for coal and oil and gas production evolved
in these three regions of the world.
As for the third, country level, it can be assumed a priori that in these three
regions the richest countries in the world possess fuel resources. They are
considered in detail during laboratory exercises, based on the principle of
"top ten.”
Table.2.
Source: Distribution of the proven energy reserves by countries at the beginning of XXI Century (V.
Maksakovsky. 2009)
|
Country |
Coal.
Billion Tones |
Country |
Oil,
Billion Tones |
Country |
Natural
Gas, Trillion M3 |
|
USA |
250 |
Saudi
Arabia |
35 |
Russia |
48 |
|
Russia |
195 |
Canada |
28 |
Iran |
27 |
|
China |
115 |
Iran |
18 |
Qatar |
26 |
|
India |
85 |
Iraq |
16 |
Saudi
Arabia |
7 |
|
Australia |
82 |
Russia |
15 |
United
Arab Emirates |
6 |
The first five countries in proven reserves of fuel resources (V. Maksakovsky. 2009).
Analyzing
Table 2, we can be limited by the first three countries. A simple calculation shows that the share of
the United States, Russia, and China
accounted for more than half of all the world's known coal reserves whereas
that of Saudi Arabia, Canada, and Iran to about 2/5 of the world's oil and
Russia, Iran, and Qatar - almost half of the natural gas reserves. Those countries
that occupy the first three places are - the United States, Saudi Arabia, and
Russia should be especially singled out (V. Maksakovsky. 2009. P. 103).
There
are a number of advantages of the above–mentioned countries. The most
important one is the special richness of their fuel resources. Thus, the largest
explored reserves of coal basins of the world are found in the United States
(Illinois, Appalachia mountains), Russia (Kan -Achinsk, Kuznetsk), and China
(Ordos) (Keaton Energy. 2010). The same applies to the richest petroleum
provinces of the Persian Gulf. But in the case of oil and gas, a crucial role is
not played by the total number of fields and the presence of these fields with
the giant and more unique stocks.
The
number of unique non-competitive oil fields in the world occupy the Gulf
countries, where they are genetically related to the sediments of the Arabian
plate and the Mesopotamian basin. It is here that the major oil Ghawar (Saudi
Arabia), Agha Jari (Iran), and the Greater Burgan (Kuwait) with initial reserves
of more than 10 billion tons each appear (Ivanhoe, L. F, and G G. Leckie. 1993).
According to a number of unique natural gas fields worldwide, the leader in the
Russian northern part of Western Siberia. Qatar recently opened a unique gas
field, Qatar -Nord, which immediately put forward this tiny country in the top
four countries in the world according to the largest proven reserves
(International Energy Agency. Paris, 2012).
With
regard to metal reserves, they are more common in the earth's crust than fuel. This is explained by the fact that they are genetically linked not only
with sediments but also crystalline rocks (remember Baltic shields or
Canadian). For ore resources, it is a much typical zonal distribution. We should
be aware of two major metallogenic belts of the earth - the Alpine- Himalayan
and Pacific, stretching huge arc at 30 thousand km (William J. Collins,
Anthony I. S. Kemp,
J. Brendan Murphy.
2011). Both of these zones are associated with deep crustal faults, originated
in the Alpine orogeny and that within them should first seek many ore minerals
- whether iron ore in India, tin - in Malaysia or copper in Chile.
In
assessing the ferrous and nonferrous metals it is the need to consider some of
their features. First, the fact that they have rarely explored reserves the
amount to hundreds and tens of billions of tons and, usually, they are
considered to be billions, tens of millions, and millions of tons. Secondly, this is
due to the content of the useful component of the ores varying from less than
1% and up to 60-70 % (Science Encyclopedia. 2005). It is clear that the low composition
of the metal in ore leads to assessing
their deposits according to useful components rather than ore and, therefore,
their amount is further reduced. Third, the collection of ore resources itself
is much broader than that of fuel – their amount is about 35. We should think
at least about ferrous metals - iron, manganese, chrome, alloy metals -
titanium, vanadium, nickel, cobalt, ferrous and light metals - magnesium,
copper, lead, zinc, bismuth, precious metals - gold, silver, platinum.
Therefore, we can meet with them only on the separate examples – we can just
discuss separate examples.
As
a first example, consider iron ore widely distributed in the earth's crust.
Their resources amount to 350 billion tons in the world and are mainly
concentrated in the post-soviet space, North and Latin America, and Asia.
Explored reserves are estimated at 165 billion tons and they are known in some
100 countries with a strong predominance of just a few of them. Here, the
first five are Russia, Brazil, Australia, Ukraine, China. At the same time,
Russia has a non-competitive first place - 33 billion tons or 20 % of world
reserves (Maksakovsky V. 2009) which are concentrated primarily in the Kursk
magnetic anomaly and several other unique and large-sized swimming pools. Pool
Hammersley dominates in the stocks of Australia in the northwest of the
country whereas in Ukraine - Kryvyi Rih.
Bauxite
- the main raw material for aluminum production serves as a second example,
which is also very widespread in the earth's crust. Explored reserves of
bauxite amount to 20 billion tons (Maksakovsky V. 2009). To understand the main
pattern of their placement on the globe, we must remember that bauxite deposits
are genetically related to primarily weathering crust sections located within
the tropical and subtropical climatic zones.
That's
why, one of the main provinces of the bauxite world includes Guinea in Africa
(more than one-third of all proven reserves), North Australia, Caribbean
Central America, Mediterranean Europe.
Uranium
resources are widely distributed in the earth's crust. However, it is
cost-effective to develop only those fields that contain at least 0.1% of the
useful component: in this case, 1 kg of uranium concentrates cost is less than
$ 80 of the explored reserves of uranium available for retrieval at a price of
3.5 million tons and Australia, Kazakhstan, Russia, Canada, and South Africa are
included in the top five countries in this case. In Canada, the uranium content
in the ore is 10%, in Australia - 0.5% (V. Maksakovsky. 2009).
The
third group, as already mentioned, is non-metal resources. We will not consider
them in detail. We note only that, according to the volume of those resources,
among them are sodium and potassium salts, phosphorus, and sulfur.
To
conclude the description of mineral resources, two other issues need to be
considered.
First,
these resources are distributed between economically highly developed and
developing countries. Economically advanced countries are ahead in proven
reserves of coal, iron, manganese and chrome ores, poly-metallic, uranium, and
gold. Developing countries lead in oil resources (more than 4 /5 of the total
reserves), natural gas, bauxite, copper ore, tin, tungsten, Diamond (Conklin Xu. Laura Bell. 2013).
Secondly,
to what extent humanity is provided by critical - mineral resources. If we
consider only the proven reserves, many kinds of minerals will not be enough
for a long time. For example, oil, natural gas, copper, zinc, lead, tin,
tungsten will disappear in about 60 years (Conglin Xu. Laura Bell. 2013).
Notably, this happens taking into consideration the volume of their extraction
at present. Another added factor is that the "appetite" of humanity
is continuously growing!
Of
course, differences between regions and countries according to mineral
resources can be very large. For example, proven oil reserves are more provided
in Canada (which will be enough for 230 years), wherein the Alberta region
there are the world's largest deposits of tar sands and scientists have only
recently begun to consider those reserves in international statistics. This
country is followed by Iraq, Iran, Kuwait, United Arab Emirates, Venezuela
where reserves will be kept for about 100 to 150 years. But in Europe and
Australia oil wealth is enough for only 9 years whereas in the U.S. - 11 years.
In Russia, this figure amounts to 32 years (V. Maksakovski. 2009).
Turning
to the characteristics of the land (soil) resources, several scientists call
them territorial resources and we must first note that the earth is a kind of
universal resource without which neither man's economic activity nor his life
will be possible. However, with this multi-purpose land use at any given time,
one or another piece of land can only be used for one to several purposes -
granting, plowing, etc. It is important to note that although the land (soil)
resources we are belonging to the category of exhaustible, renewable
resources and renewal of them really requires a lot of time.
During
the discussion about land resources, a fundamental concept represents the land
fund. To get an idea of the size of the land fund of the planet, we should take
into account a total of Earth's land area (149 million km2 or 14.9 billion
hectares) subtract the area of Antarctica and Greenland. The final result is
134 million km2 or 13.4 billion hectares, and it is the total amount of the
land fund (Pidwirny, Michael. 2007).
This is a tremendous resource that is admittedly very encouraging. However,
familiarity with the structure of the land fund (Fig. 2) leads to somewhat
different conclusions.

Fig. 2. Types of the global land fund
Source:
https://www.ufz.de/export/data/global/54001_LSA_Map.jpg
It
turns out that the less or unproductive lands are wholly or partially unfit for the
life and carrying out business activities of people, occupy the first place in
this structure. Forests and shrubs take second place. As for two types of
agricultural land, arable and mowing ones, they share third and fourth
positions, occupying only 1/3 of the total land fund, including, mainly
cultivated ones, which yield in nearly 9/10 of all necessary food products for
people, accounting for only 11% (V. Neidze. 2004).
Admittedly,
at the regional level, all these figures can vary greatly. The share of arable
land is much higher in Europe and Asia, that of meadows and pastures - in
Australia and Africa, the proportion of forests - in South America and in
Russia, and the share of marginal and unproductive land - in Asia, North
America, Africa. Of course, there are even more differences between individual
countries. For example, in Denmark, India, and Bangladesh plowed land prevails
and amounts to 55%, in Mongolia 75 % of
the land is occupied by pastures, and in Libya, located mainly within the
Sahara desert, over 90 % of the land is less productive and unproductive (V.
Maksakovsky. 2009). Table 3 represents individual countries with the largest
area of arable land.
Table 3. The
first five countries according to the size of arable land at the beginning of
XXI Century
Source:
V. Maksakovsky. 2009. P. 107
|
Country |
Area
of the Land. Million Hectares |
%
to the Land Fund |
|
USA |
186 |
20,3 |
|
India |
166 |
55,9 |
|
Russia |
117 |
6,8 |
|
China |
93 |
9,9 |
|
Australia |
47 |
6,1 |
Of
course, historically the land fund structure does not remain unchanged. Two
opposite processes Thus influence the structure of the land.
On
the one hand, for hundreds, even thousands of years, people have sought to
increase the area of land suitable for habitation and agriculture. Primarily,
this means the offensive field on forest landscapes. It is not by accident,
that XIV c. entered into the history of Europe as the "age of
uprooting." Of course, the fields began to attack the landscapes and
pastures. As a result, only in the twentieth century, the area of cultivated
lands in the world has more than doubled. Remember though epic virgin lands
that have been mastered in Canada, USA, Australia, Brazil, China.
On
the other hand, it was going on all the time and in the second half of the
twentieth century, the process of the degradation of the land (soil) resources
accelerated. Now, in the world, the high and moderate degradation exposed 2/3 of all the arable land. The main cause of this degradation is the
development of erosion due to which each year 6-7 million hectares of land
falls from the agricultural turnover (V. Neidze. 2004).
As
for the vast arid zone, anthropogenic desertification became the main
reason for land degradation, which has already covered about 10 million km2,
which is comparable with the territory of such giant countries as Canada, China, or the U.S. More than 1 billion people from about 100 countries around the
world live under the conditions of anthropogenic desertification and soil
degradation (V. Maksakovsky, 2009).

Fig. 3. Areas for concern for soil degradation
Source:
http://www.globalchange.umich.edu/globalchange2/current/lectures/land_deg/land_deg.html
Despite
the importance of the specific indicator of providing the land resources, the
more important index represents the availability of the most valuable cropland.
Worldwide, it has declined from 0.5 hectares in the middle of the twentieth
century to 0.2 ha in the early XXI century. Australia (2.6 hectares) and
North America (0.6 ha) appear again the most successful in this regard and the lowest index is reported in East Asia (0.1 ha), South Asia, and Western Europe
(0.2 hectares). From selected countries (besides Australia) Kazakhstan and
Canada (1.5 hectares), Russia, Ukraine, and the United States (0.6-0.8 ha)
occupy the leading positions, and the Netherlands, Japan, Egypt, Vietnam, Bangladesh,
China are at the end of the list with exponents from 0.03 to 0.07 hectares per
person (V. Maksakovsky. 2009).
Geography of the world's
natural resources: water and biological resources of the land
Water,
like the earth, is an indispensable condition of human life, which
satisfies their physiological and sanitary needs. Admittedly,
people can stand much longer without food than without water. From this, by the
way, comes some fundamentally new concept in medicine – This is where the
new concept of medicine originates from. An almost equal amount of water is needed
for a variety of businesses of the people, which is largely based on the
"wet" technology. It refers to the production of food, energy, and
industrial products.
Let's
start with the introduction of land water resources according to their nature.
Although
freshwater resources in the world amount to only 2.5 % of the entire
hydrosphere, this corresponds to 35 million km3 (Neidze V. 2004). But the
reason for optimism related to this fact is not so much – This does not quite
give any reason for optimism. The fact is that almost 70% of this volume, is
admittedly conserved in the ice sheets of Antarctica and Greenland, the Arctic
ice and mountain glaciers. Groundwater accounts for another 30% but they are
used in relatively small quantities. It turns out that free freshwater is
available in rivers, lakes, wetlands, atmosphere - it is only 0.3% of all fresh
water on the Earth (V. Maksakovsky. 2009).
But
even with this approach, the most reasonably available resources are considered
to be the most dynamic part of freshwater - the river (river bed) water
flowing into the oceans. Their lump sum amount in rivers is negligible - only
2.1 km3. But since this volume is renewed during the year on average for 23
times, in fact, available resources of the river waters rise to 48 km3 (V.
Maksakovsky. 2009. P. 110). Apparently, this number characterizes the
"water ration" of humanity that can (to some extent) withdraw for
economic activity.
Now
from the quantitative assessment of the freshwater resources of the world,
let`s turn to the consideration of their geography. If we keep in mind the
major regions of the world, according to common freshwater resources leading
positions to have Russia (1/5 of the World`s supply), Latin, and North America (V.
Maksakovsky. 2009). If we consider only the resources of river flow, then go
forward to Asia and Latin America, It is clear that here we have in mind first
the all river systems, the leading positions have Yangtze, Brahmaputra, Ganges,
Mekong, and the second - the Amazon, Orinoco, Paraná. There are several
changes and the order of the leading countries (Table 4).
|
Country |
Resources,
km3 |
|
Brazil |
6950 |
|
Russia |
4300 |
|
Canada |
2900 |
|
China |
2800 |
|
USA |
2500 |
Table
4. The first five countries in the world in size resources streamflow in the
beginning of the XXI Century
Source: V. Maksakovsky. 2009. P. 111
This is the situation related to the freshwater resources that nature made
available to mankind. However, from the standpoint of socio-economic
geography that is not enough – the principles of water consumption should
also be taken into account, which is constantly increasing. It is enough to say
that only in the twentieth-century global water consumption has increased several times and now amounts to almost 3000 km3 per year (Nitti, Gianfranco.
2011p. 8). Some experts believe almost half of the total available amount
of fresh water has been used on our planet. Moreover, almost 70% of it goes
to agriculture and is lost forever (Nitti, Gianfranco. 2011). With regard to
the industry and utilities, where the water recycling principle is intensively
used, those fields of economy are respectively at the second and third places.
Undoubtedly, for large regions of the world, the water consumption rate also varies
greatly. As expected, the Eastern part of Asia is leading with first place. In
this part of the world water consumption in agriculture predominates. Although,
in some countries (China, Japan) an appreciable proportion of the industry is
reported (The Water Footprint Network. 2014). Agricultural use is also
prevalent in Africa, Australia, and Oceania, a large part of Latin America, and
industrial and municipal - in North America, Europe.
The
main point to be noted in this regard is the characterization of provision with
freshwater resources, which is calculated on the basis of per capita. The
average per capita freshwater availability is constantly decreasing as though
these resources are growing and, in any case, slower than the population. If
this indicator is put at stake, the differences will be clear
(Fig.
4).

Fig.
4. Consumption of freshwater per capita. M3 Annually
Source:
http://www.mapsofworld.com/world-freshwater-resources.htm
It was immediately struck by the presence of two well-defined zones of sufficient and
excess moisture. The first of these is in the range of temperate and
subtropical climate zones of the Northern Hemisphere and includes Canada, the
United States, the Nordic countries, Russia. However, countries of Europe,
located in this zone, are already experiencing a lack of freshwater. The
second zone extends within the equatorial and tropical climatic zones, mainly
in the Southern Hemisphere. Between them extends the arid belt with the biggest
shortage of freshwater.
Interestingly,
if during the analysis of this indicator to apply to the principle of
"most-most", it would appear that provision of renewable freshwater
resources in a number of countries, and in this case, champions are French
Guiana (over 800 thousand m3 per person!) and its neighboring Guyana and
Suriname (300 thousand), DR of Congo (about 300 thousand) and Iceland (250
thousand), the minimum water supply indicators are in Kuwait (10 m3), the UAE
and Qatar (less than 100 m3), Saudi Arabia and Libya (slightly more than 100
m3). This means that in French Guiana shower provision of such resources is
higher for 8 thousand times (!) than in Kuwait (V. Maksakovsky. 2009. P. 113).

Fig. 5. Percentage of Population Without Reasonable Access to Safe Drinking Water
Source: http://www.theglobaleducationproject.org/earth/human-conditions.php
Reportedly, the problem of freshwater - as farmland - in fact, has already become global. In fact, according to the UN, at the beginning of the XXI Century, about 1.2 billion people lacked access to safe drinking water (Fig. 33), and more than 2.4 billion to improved sanitation (Basic Facts about the United Nations. 2004. P. 144). In these least developed countries in Asia and Africa, such as Nepal, Cambodia, Ethiopia, Chad, Mauritania less than one-third of all residents have. secured access to drinking water. We must take into account the fact that in most developing countries there is not just a shortage of water, but also the quality of its is poor. It is the consumption of contaminated water in them that is the source of two-thirds of all diseases. According to UN projections, universal access to safe drinking water will be provided in Asia - until 2025, Latin America - up to 2040, and Africa – 2050 (The Millennium Project. 2012).
Here,
we come to the important issue related to the resolution of the problem of
water of humanity divided into major and minor factors.
To start
with, the main focus should be made on principal factors. The use of water and reducing its wastage/deadweight loss of water during
industrial processes serve as the key ones. In
industry, it is primarily concerned with the production of synthetic fibers
during which approximately 3500 tons of water are consumed
per ton of the product whereas, in the case of nickel, it amounts to 800 tons and
200 for the production of iron,
steel, and paper. As for
agriculture, 10 000 tons account for cotton production and 7000 ones for rice
growing. It is worth mentioning that in the process of cotton production the
Aral Sea suffered significantly. Economical use of water is necessary for
carrying out everyday activities too provided that in economically developed
countries one city inhabitant does not consume less than 300-400 liters of
water. 100 liters of water are used
for several minutes while getting the shower.
Sparingly,
water should be consumed in everyday life. Indeed, in economically advanced
countries an urban resident consumes at least 300-400 liters of water per day. Only
receiving the shower for a few minutes required 100 liters (V. Maksakovsky.
2009).
The
second most important measure is the construction of reservoirs for river
regulation. It is estimated that with their help the global river flow could be
increased by 1/4. Over the past half a century the number of reservoirs around
the globe has increased by about 5 times. Now there are more than 60 million
with a total useful volume of 6600 km3. Together, they occupy 400 km2
(V. Maksakovsky. 2009).
As
in the case of land resources, many programs for the conservation and
restoration of freshwater resources are directed by the UN, which in 2002
announced the "Decade of Water" and in 2003 proclaimed the "Year
of Freshwater". This has stimulated the increased public attention to the
problem of the water supply of the world, by its individual regions and countries,
not only in the present but also in the future. Some politicians are already
predicting the possibility of "water wars" - acute conflict over
water resources (J. Simon. 2005).
To
finish with water resources, they also have their hydro-energetic potential
which has three grades. Potential resources of river flows and reservoirs are
meant under the theoretical hydropower potential. Usually, it is estimated at
35-40 trillion kW/h. Next comes the
technical hydropower potential, which is part of the theoretical capacity,
which can be technically mastered. Most often it is estimated at 15 trillion
kW/h. Finally, the economic hydropower potential is the total energy resources
of the rivers the use of which is the
Top of the Form, including, the cost of construction of the hydroelectric power
station and the cost of electricity, which is economically feasible. It is estimated
at 8 trillion W • h (V. Maksakovsky. 2009).
In
economic geography literature, you often come across the indicator of economic
hydropower. As the volume of river flow, here ahead of the other regions are
Asia and Latin America. Similar to the data in Table 5, looks and the five richest
countries by hydropower resources (Table 6).
Table. 6. The first five countries in the economic size of hydropower
Source:
V. Maksakovsky. 2009. P. 117
|
Country |
Hydro
energy potential. Billion K/h |
The
degree of its exploitation |
|
China |
1260 |
16 |
|
Russia |
850 |
19 |
|
Brazil |
765 |
37 |
|
Canada |
540 |
65 |
|
India |
500 |
16 |
It is easy to calculate that these five countries account for almost half of
all global economic hydropower. As for the extent of its development, it is the
average for the world not reaching 1/3 whereas for Europe and North America it
is 70% and 18% for Africa. (V. Maksakovsky. 2009).
France,
Italy, and Switzerland serve as examples of countries where this potential
is almost fully mastered whereas Japan and the United States are the ones with
almost completely achieved potential.
Biological
resources – there are resources of the Earth's biota, i.e. plants and animals,
which are measured in trillions of tons. The gene pool of such organisms is
distinguished by exceptional biodiversity: according to various data, it
comprises from 10 to 100 million different species. However, only 1.7 million
are described among them. (Biological
Resources. 2013).
The
biomass of planting resources of the earth's land is about 200 times more of
the biomass of wildlife. It is represented by both cultural and wild plants.
Including crop species, there are almost 6 thousand, but the amount of most
common crops in the world equals only 80-90 and the most common - 15-20:
wheat, rice, corn, potatoes, barley, sweet potatoes, soybeans, etc. (V. Neidze.
2004).
Forest
vegetation, forming forest resources plays a major role among wild plants.
With their characteristic, we must first remember that the forest as a part of
the biosphere on Earth forms the largest ecosystem, which significantly affects photosynthesis, the oxygen balance of the atmosphere, the preservation of
the gene pool. In the same economic activity of people, wood is widely used for
the production of 20 thousand different products, as well as fuel. Forest
resources are exhausted as land ones but at the same time, renewable resources
of the multipurpose use emerge (V. Neidze. 2004).
For
the forest`s resources assessment is typically measured by the forest or the
forested (which is the main part of the forest) area. As we have mentioned
during the meeting with the structure of the land fund, the forest area of the
world is 4.1 billion hectares, which corresponds to an average of 30.5% of the
forest cover. According to various estimates, the stock of standing timber in the
forests of the world reaches amounts to 330-380 billion m3 and annually rises
by 5.5 billion m3. (World Resources
Institute. 2010). It would seem that it is quite a comforting figure. But they
need a serious adjustment in light of two important factors.
The
first is called the natural-geographic factor. It is a very uneven distribution
of the forests on the land surface. If we consider the large regions of the
world, it turns out that most wide areas of the forest are in Latin America.
Here it is fixed at the highest percentage of forest and timber stock. The
lowest rates are fixed in Australia and Oceania. But with regard to the
characterization of such forests with the geographical unevenness, forests
reserves can be discussed in different ways based on the fact that the world's
forests actually form two huge forest belts along the strike zones - north and
south. (Fig. 6).

Fig. 6. Schematic map of the world's forests
Source:
http://www.mapsofworld.com/world-natural-forest.htm
Obviously, the northern forest belt extends to broadband across North
America and Eurasia, taking up about half of the total forest area in the
world. It is dominated by coniferous and mixed forests of the cold temperate
and subtropical climatic zones of the earth. The Southern forest belt consists
of three parts - the South American, African, and Asian - Australian. By the
area, it is about the same, but almost entirely consists of deciduous forests
and is a much more diverse forest, richer, and most importantly, updated much
faster. Therefore, there are more stocks of forests in the southern belt. And
between them is an almost completely treeless arid, torrid zone, which has been
continuously mentioned above.
Such a belt approach is the "golden key" to understanding why some
countries are very rich in forest resources, while others, on the contrary,
are very poor. Clearly, the rich countries by the forests resources can be
founded within the northern and southern forest zones. In this case, it should
be mentioned that in the northern zone it is Russia (810 million hectares of
forest area), Canada (310), the United States (305), and partly China (195) and in southern - Brazil (480), Australia (165), DR Congo (135) and some other
countries (V. Maksakovsky. 2009).
Additionally,
within these two zones you will find a country with record levels of forest
coverage, which is in Finland, North Korea, Democratic Republic of Congo,
Gabon, more than 70 % in Guyana and Papua - New Guinea - 80, and in Suriname,
even 90%! The middle arid zone is distinguished from the most sparsely
populated countries. Here, too Saudi Arabia, Jordan, Libya, Central African
Republic are the “champions” among the countries where forests cover less than
1% of the area, excluding, Kuwait or Oman, where they are absent (Convention on
Biological Diversity Secretariat. 2012).
This,
again, first is the natural and geographical factor influencing the wealth of
forest resources of the regions and countries. With regard to the second
factor, it is only part of the natural essence. What it mainly represents is the
“anthropogenic” factor, i.e. the impact of humanity on the process of reducing
forest resources.
Man-made
deforestation began in the Neolithic, when, as we already know, agriculture and
animal husbandry were created. It continued in the era of the ancient
civilizations of antiquity, in the Middle Ages, in modern and contemporary
times. Only in the last two centuries, the forest area of the world has halved
and today, it continues to decline at a speed of 13 million hectares per year.
But, the situation in the northern and southern forest zones is very different
(FAO. 2012).
Geography of the world's
natural resources: the resources of the oceans, climate, and space, recreational
resources
In
this part, we will finish the description of the world's natural resources.
If until now we have considered the resources of the Earth's land, now we turn
to the resources of the oceans, atmosphere, and space, as well as a special kind
of recreational resource.
Admittedly,
the World Ocean is another pantry of various resources at the disposal of mankind. Resources of the oceans can be divided into 1) water; 2) minerals; 3)
energy and 4) biological (Nellemann C. and Corcoran E. 2010).
From
the materials in the physical geography, we should know about the fact that the
World Ocean encompasses virtually inexhaustible water resources. Indeed, the
total amount of its waters is 1.37 billion km3, which corresponds to 96.4 % of
the total terrestrial hydrosphere, and they occupy almost 71% of the surface of
our planet (World Atlas. 2013).
Talking
about the waters of the World Ocean, we must remember that they themselves have
considerable economic importance since they contain about a hundred chemical
elements. It's hard to imagine but one km3 of ocean water can hold a huge
amount of dissolved minerals. Sodium and chlorine are the most widespread ones
in the water. So, even thousands of years B.C. Chinese learned to get table salt
from it. It is also possible to get magnesium, bromine, iodine, potassium,
hydrogen and oxygen, and other chemicals from the marine water. Technologically,
there are developed methods for recovering from there the uranium and gold even
though its content is 0.0001 mg / l (Christie, A and Brathwaite, R. 2012).
The
same applies to obtaining deep, the so-called heavy water (it has a slightly
different combination of hydrogen and oxygen isotopes) of deuterium required
for the thermonuclear fusion.
Mineral
resources of the World Ocean are geological resources of raw materials and
fuel, which are lying on the seabed or in the subsoil. Geographically and
genetically they are usually divided into resources of the continental shelf,
the continental slope zone, and deepwater areas of the ocean floor (Fig. 7).
Resources of the continental shelf play a major role among them, which covers
31.2 million km2 or 8.6% of the total area of the ocean (Pinet, Paul R.
(1996).
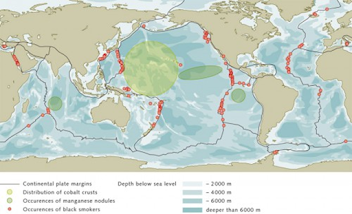
Fig. 7. Mineral resources of the ocean floor
Source:
http://worldoceanreview.com/en/wor-1/energy/marine-minerals/
In
its turn, among those resources, the basins of oil and natural gas are the most
important together occupying almost more territory than oil and gas basins in
the Earth's land area. It can, therefore, be concluded that the Atlantic Ocean
is leading among the richest hydrocarbon resources, where they have already
been explored in many marine spaces. Three of them need to be focused on: the
Caribbean Sea and the Gulf of Mexico in Central America, the Gulf of Guinea in
West Africa, and the North Sea in the north-western part of Europe. Smaller
deposits are discovered near the coast of Canada, Brazil, Argentina. The Indian
Ocean is at the second place by those resources, where oil and gas are found on
the shelves of India, Indonesia, Australia, but most of all - in the Persian
Gulf, where, incidentally, some offshore fields (Saffaniya, Qatar -Nord) are of
the unique size. In the Pacific, the coast of Asia, North and South America,
Australia are famous for oil and gas
resources, and in the Arctic Ocean - the coast of Alaska, Canada, and Russia
(Barents and Kara Seas) dominate. The Caspian Sea should also be mentioned
where near Baku oil production was conducted for a long time but the "big
oil" was opened recently.
Besides
oil and gas, many solid minerals are connected with the shelf of the oceans and
related fields. Among them, there are indigenous deposits of coal, iron ore, and
other salts that may be developed from the shore by means of inclined tunnels.
As
for energy resources of the World Ocean, they are limitless similar to the
water resources. Their main types are - tidal power, waves, temperature
gradient, and ocean currents. Yet, they are mainly related to potential
resources, but their use has already begun.
Speaking
about tidal energy, we should note its advantages and disadvantages. The
advantage is its inexhaustibility, regularity, and environmental cleanliness. In
fact, the energy contained in only one tidal cycle reaches 8 trillion kW • h
(which is only half of the world's electricity generation in the year) (V.
Maksakovsky. 2009) and such cycles are repeated twice a day and they work
"on schedule" to within a few minutes. As for disadvantages, tidal energy can be effectively used only in those places where the exceeding
tide height is 5 meters, and around the globe, there are approximately 25-30.
Admittedly, the highest tides are off the coast of the Atlantic Ocean: in the
north-western part of the Bay of Fundy they reach 18 m, and in the northeastern part, near the shores of the English Channel and the Irish Sea - 10-13
m (V. Maksakovsky. 2009). Such tides are present in the north-western Pacific
(e.g. in the Okhotsk Sea) and the Arctic Ocean (e.g. in the White Sea), i.e. in
most cases in very remote and sparsely populated areas.
As
for the biological resources of the world’s ocean, their total biomass is often
estimated at 35-40 billion tons, which is much less than the total biomass of
the Earth's land (Ocean Resources. 2001).
Nevertheless,
it has 180 thousand animal species and 10 thousand plant species (Ocean
resources Defense Council. 2014). This means that the water of the oceans is
populated by the many living organisms of the world, from microscopic bacteria
to the largest animals on earth – whales; while they live throughout the
thickness of oceanic waters from the surface layer to the bottom of the deepest
valleys.
As
for the issue of climate and space resources, they belong to the category of
inexhaustible resources and practices that are not removed from nature but
nonetheless can significantly affect the living conditions of people and
economic activity.
Climate
resources are closely related to certain features of the climate.
Undoubtedly, those are primarily agro-climatic resources, i.e. light, heat, and
moisture, which determine the possibility of growing all crops.
Further,
there are wind energy resources. Their use has started a long time ago with
windmills and sailing ships. Although this energy is different by the
scattering and inconstancy, the world still has a lot of places where the
average wind speed exceeds 5 m/s, which makes this energy use, which is
environmentally clean with the help of using economically viable wind
turbines. Examples of such places only in Europe can serve the coast of the
North, Baltic, Black seas as well as mountain areas (Holttinen, Hannele. 2006).
When
talking about cosmic resources, solar radiation - the largest energy source
in the world is primarily meant. It forms the basic processes in the biosphere
and ensures the existence of life. The power of the solar energy reaching the
lower atmosphere and the earth's surface is measured by a huge quantity (1014
kW). It is by ten times superior to all of the energy contained in the proven
reserves of fossil fuels and by thousand times - the current level of global
energy consumption (Reference Solar Spectral Irradiance.
2013).
However,
solar power is widely dispersed, so its use is appropriate only in areas
with low clouds, receiving it in quantities exceeding 200 W/m2 (World Meteorological Organization.
2008).
All
of them are hot climate zones of the Earth, and partly subtropical, within
which mainly developing countries are located. But due to its economic and technical
advantages, solar energy for commercial purposes is used in the United
States, Japan, Israel, and Australia to the greatest extent.
In
conclusion, we should analyze one more interesting question related to recreational resources. The word ‘recreation’ in Latin means
"restoration" (The Free Dictionary, 2014). Respectively, those
natural resources are involved with the help of which the people's health and
their ability to work are maintained and restored. But, besides this, recreational
resources are an important source of aesthetic pleasure, which is also worth
mentioning.
Recreational
resources serve as a basis for recreation and are closely associated with
tourism. In other words, there are resources of recreation and tourism, though
sometimes tourist resources are allocated separately. In recreational
geography, there are four main types of recreational use of the territory. The
first one is therapeutic, which uses healing waters, mud, comfortable climate.
The second - beaches of seas, rivers, lakes, reservoirs, forests, and parks. The
third type represents sports activities, including, skiing, sailing, and
mountain climbing. Fourthly, the recreational and educational type is based on
natural and cultural heritage sites and cultural landscapes (Rechner. 2010).
According
to another approach, all recreational resources can be grouped into two large
classes.
The
first of them form natural recreational resources, among which are the seashores, riverbanks and lakes, mountains
and hills, forests, mineral springs outputs, therapeutic mud. Here vacationers
and tourists find natural diversity, scenic, and attractiveness, landscapes, the richness of vegetation,
pleasant to the eye relief, healing climate. And often it is the combinations
of the above-mentioned attractiveness.
The
second class is formed by cultural and historical attractions - monuments of
the history, archeology, urban planning, architecture, literature, and art,
which are the main prerequisite for the organization of cultural and cognitive
recreation and also largely determine the direction of recreational flows of
people, in which you are involved too.
Obviously,
the greatest interest among vacationers and tourists is expressed towards those
countries, that possess a combination of natural, cultural, and historical
attractions, such as Italy, Spain, France, Switzerland, Bulgaria, Egypt,
Mexico. The same applies to certain areas of many countries that are
specialized in recreation and tourism for a long time.
The
World Heritage Site needs to be mentioned here. This concept has been existing
since 1972 when UNESCO adopted the Convention on the World Cultural and
Natural Heritage. It lists the heritage objects, which are replenished every
year. At the beginning of 2007, it already included 830 sites in 138
countries.
From
the total number of heritage sites, 644 are classified as cultural. The Forum
and the Colosseum in Rome, Versailles near Paris, Westminster and the Tower of
London, Hradcany in Prague, the great pyramids in Cairo, the Taj Mahal in
Indian Agra, the historic imperial city in Beijing and the Great Wall of China,
Statue of Liberty in New York, the ancient Mayan city in the Yucatan Peninsula
in Mexico serve as examples of the most famous of them. The category includes
162 natural objects too. Many of them are well known: Bialowieza Forest in
Poland and Belarus, Mount Everest in Nepal, Lake Victoria and Mount Kilimanjaro
in East Africa, the Grand Canyon on the Colorado River in the United States,
Galapagos Islands in South America, and the Great Barrier Reef in Australia. In
addition, an additional 24 mixed, natural and cultural properties are allocated.
World Heritage forms a huge recreational resource of universal significance,
which is an important incentive stimulus for recreational activities.
Many
geographers point out that among the cities millionaires, about 4/5 of all
residents are eager to spend their holidays in nature, i.e. to be engaged
precisely in such activities. Forms of such activities are extremely varied.
Conclusion
In
the process of producing material wealth, a man actively influences a single
element of nature and changes the whole complex of natural resources. One part
of the natural resources are inexhaustible because they are self-renewed in the
footsteps of their proper exploitation. There are also natural resources whose
supplies are gradually depleted and eventually depleted. Therefore, the
rational use of natural resources is the primary concern of mankind. The modern
scientific-technological revolution further expands the field of use of natural
resources and allows us to identify new types of natural resources.
Literature
Maksakovsky,
V. (2009). General Social and Economic Geography of the World (in Russian).
Neidze,
V. (2004). World Social and Economic Geography. Ed. ”Lega”. Tbilisi, Georgia (In
Georgian).
Basic
Facts about the United Nations. Department of Public Information. United
Nations, New York, 2004. P. 3.
P.
Marshall. Nature`s Web: Rethinking Our Place on Earth. London: Cassel, 1995.
R.
Eckersley. Environmentalism and Political Theory: Towards an Ecocentric
Approach. London: UCL Press, 1992.
A. V. Cheltsov.
Measurement facilities in systems for monitoring industrial-process ecological
impact. Online ISSN 1573-8906. June 1992, Volume 35, Issue 6,
pp 643-645
William J. Collins, Anthony I. S. Kemp,
J. Brendan Murphy. Nature Geoscience. Two contrasting
Phanerozoic orogenic systems were revealed by hafnium isotope data. 2011.
Pidwirny,
Michael (2006-02-02). The surface area of our
planet is covered by oceans and continents.(Table 8o-1).
University of British Columbia, Okanagan. Retrieved 2007-11-26.
Conglin
Xu. Laura Bell. Oil and Gas Journal. Worldwide reserves, oil production post
modest rise. 2013.
Waterfootprint.org:
Water footprint and virtual water".
The Water Footprint Network. Retrieved 9 April 2014
The
Millennium Project. Water: How can everyone have sufficient clean water without
conflict? 2012
Julian
L. Simon. The Infinite Supply of Natural Resources. International Politics.
Pearson, Longman. New-York. The USA. ISBN 0-321-20947-8. Pp. 531-539
Biological
Resources. 2013 ttp://www.nerrs.noaa.gov/doc/siteprofile/acebasin/html/intro/esbiores.htm
World
Resources Institute. Forests. Sustaining Forests for People and Planet. 2010 http://www.wri.org/our-work/topics/forests
Details".
Convention on Biological Diversity Secretariat. Retrieved 2012-08-19
http://www.earth-policy.org/indicators/C56/forests_2012
World
Atlas. 2013. http://www.worldatlas.com/aatlas/infopage/oceans.htm
Christie,
A and Brathwaite, R. (Last updated 2 November 2011) Mineral Commodity
Report 14 — Gold, Institute of geological
and Nuclear sciences Ltd – Retrieved 7 June 2012
Pinet,
Paul R. (1996) Invitation to Oceanography. St. Paul, MN: West Publishing Co.,
1996. ISBN 0-7637-2136-0
(3rd ed.)
Ocean
Resources. 2001. http://marinebio.org/oceans/ocean-resources
Ocean
resources Defense Council. 2014. http://www.nrdc.org/oceans/
Bongaarts,
J., and Potter, R.G. (1983): Fertility, Biology, and Behavior: An Analysis of the
Proximate Determinants. Academic Press, New York.
ESA21.
Environmental Science Activities for the 21st Century. Population: Age
Structure.
Department
of Economic and Social Affairs Population Division (2013). "World
Population Prospects". The 2012
revision. United Nations. Retrieved June 20, 2013
UNDP.
Human Development Reports. 2011.
http://hdr.undp.org/en/content/average-annual-population-growth-rate
Comments
Post a Comment